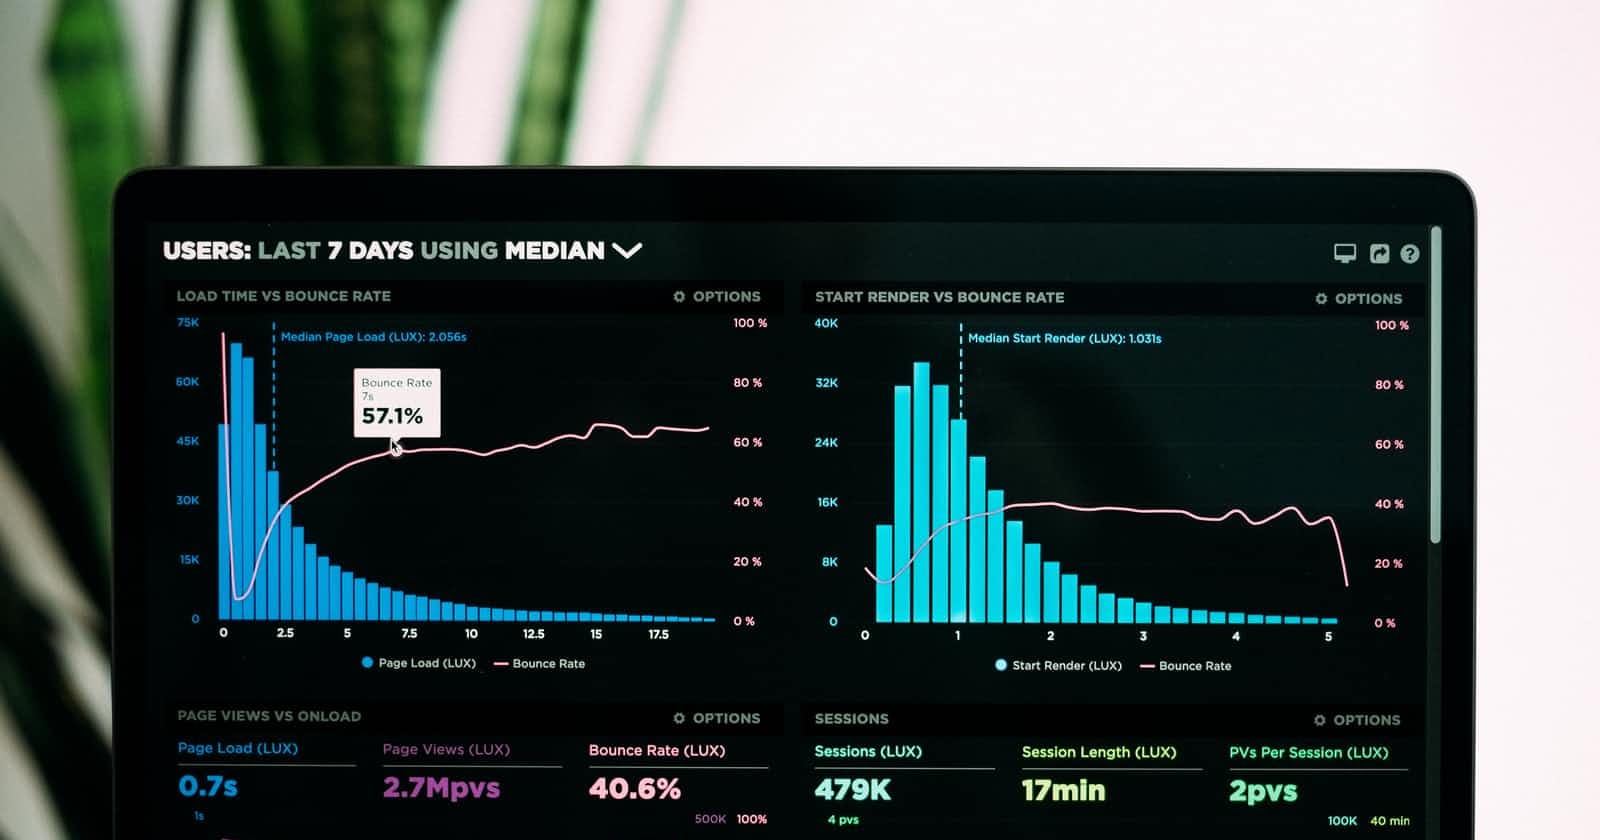
Google Cloud provides a platform for businesses to run their applications. As with any other system, it is crucial to monitor the health and status of Google Cloud to maintain optimal performance. This article will discuss the importance of monitoring Google Cloud and what you need to observe to get the most out of your system.
Knowing the status of an individual service is helpful, but it's only useful when attempting to diagnose or comprehend a broader issue or trend.
Monitoring refers to procedures and software used to maintain system status. It's a mix of software and system monitoring processes. Several elements are involved when we want to set up a monitoring system, including metrics and alerts.
Effective and efficient monitoring systems have the following essential requirements:
- Automatic alerts: monitoring tools need to generate automated alerts so that the developer can fix issues promptly. Automatic alerts allow for proactive monitoring and maintenance, rather than waiting for problems to occur and then attempting to fix them.
- Customisable thresholds: monitoring tools need to be able to use customisable thresholds to define when an event or issue constitutes a problem.
- Detailed reporting: monitoring tools also need to provide detailed reports on system performance so that administrators can identify and fix issues.
- Monitoring application: providing performance monitoring for services and collecting performance data.
Google Cloud Monitoring is a suite of tools that Google provides to help you get insights into the health and status of your system. Google Cloud Monitoring allows you to track, log, trace, and profile your applications and services and includes a set of metrics, alerts, and dashboards that can give you a clear picture of the state of your system as a whole.
Cloud Monitoring is part of the Google Operations Suite and helps you answer questions like these:
- How many instances must be used by our application workload?
- What is the average response time for our web services?
- What are the CPU utilisation levels for our most essential services?
To help us answer these questions, Cloud Monitoring provides a suite of metrics and logging data that the developer can use to understand how their systems are performing. Logs record events in your system, which can help debug and other analysis purposes and auditing.
To effectively monitor Google Cloud, you need to know what to watch and why. Google Cloud provides a wide range of services, so it is essential to focus on the vital metrics for your system. The Google Cloud Platform Console provides a dashboard that displays the health of your Google Cloud resources. This dashboard includes CPU usage, memory usage, disk space, and network traffic.
The Cloud Monitoring service enables you to collect and track metrics from your Google Cloud Platform resources to generate graphs and alerts. You can use the monitoring data to improve your applications' performance, reliability, and security. It can also help you diagnose and resolve problems before they cause customer impact. Cloud Monitoring is available globally and supports various applications and services.
Metrics
We must create our systems to generate metrics regularly to encourage disciplined problem-solving behaviour. Google Cloud Monitoring includes a set of default metrics available for all Google Cloud resources.
But what are metrics? Metrics are the variables that we measure to obtain information about our system's operational performance. These can be of two types; System and Custom Metrics.
We should collect and analyse data throughout our applications and environments, both in the production and pre-production stages and during deployment. This data can take many forms: system performance data, application performance data, server and database logs, application-specific log files, etc.
Developers will be able to generate enough telemetry events to keep deployments secure by allowing them to add metrics to their features as part of their daily work. Metrics, or telemetry events, help us understand our applications better. When our understanding of our solution is incorrect, metrics can help us see that.
System metrics
System metrics are data about the Operating System or platform an application is running on. The type of monitoring data collected pertains to the performance of an entire system, such as a server or network. System metrics can include CPU utilisation, memory usage, disk activity, and network traffic.
You can collect system metrics from the host or a monitoring agent installed on the host. Google Cloud Monitoring provides an agent that you can install on your Google Compute Engine virtual machines (VMs) to collect system metrics.
Custom metrics
Custom metrics are a way of monitoring data for your application. They are also known as application-level or application-specific metrics. These custom metrics can help us track specific KPIs for our applications. These metrics can include the number of users logged in, processed and monitoring the number of completed orders in an e-commerce application. You can get a more detailed picture of your application performance by creating custom metrics.
There are two ways to create custom metrics: through OpenCensus or the Cloud Monitoring API. OpenCensus is an open source monitoring and tracing system. Developers can use it to collect data from their applications and then analyse and report on that data. OpenCensus integrates with various monitoring systems and frameworks, such as Prometheus, DataDog, and Cloud Monitoring.
The Cloud Monitoring API allows you to create custom metrics. The monitoring API is a RESTful API that you can use to create and manage custom metrics programmatically. The API supports C#, Go, Java, Node.js, PHP, Python and Ruby.
In this article, we took a look at the basics of Google Cloud Monitoring services and how they can be used to get insights into the status of your system as a whole. We also looked at some best practices for monitoring more than one aspect of your system. Stay tuned for another article, where we will take a closer look at creating a monitoring dashboard in Google Cloud Platform. Thanks for reading!

